
PRODUCT / Flow analytics
See how one handoff enables the next.
Review continuity across work, zones, and crews.
Request a demoILLUSTRATIVE DIAGRAM / FLOW
ZONE 01
01Services
02Inspection
03Closure
ZONE 02
01Services
02Inspection
03Closure
ZONE 03
01Services
02Inspection
03Closure
ZONE 04
01Services
02Inspection
03Closure
ON THE PROJECT
One crew can be busy while another waits. Isolated completion does not explain the project's full continuity.
HOW THE WORK HAPPENS
Find where continuity breaks down.
Start from the project's work and dependency network.
Review flow dimensions and their risk signals.
Check findings with the team and decide what to address.
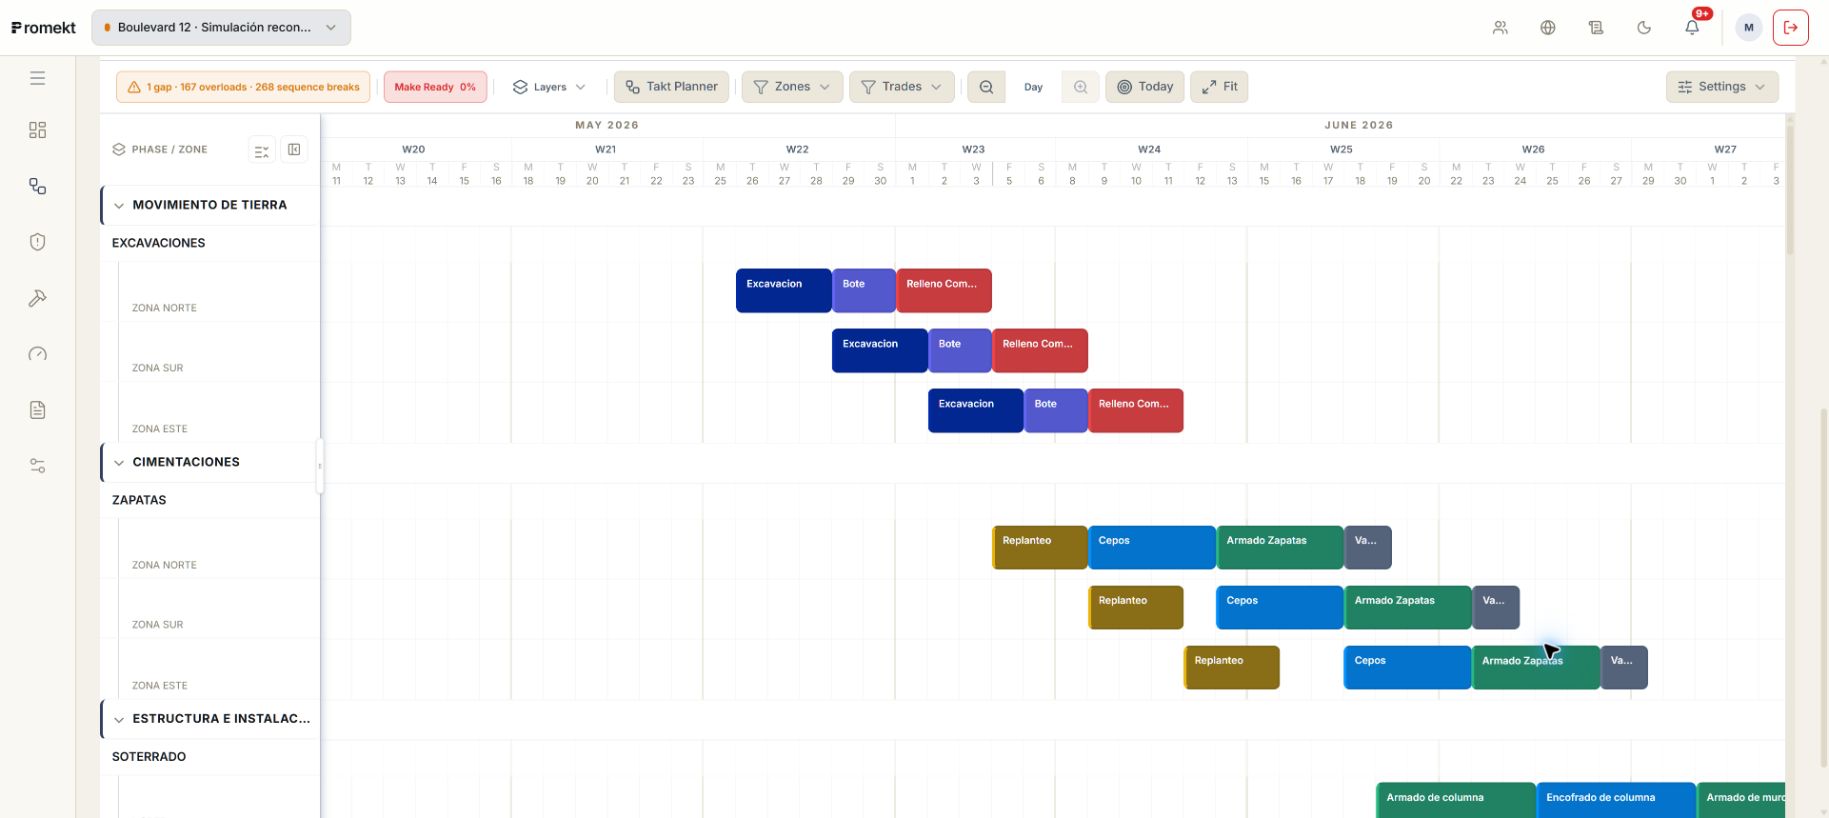 Enlarge screenshot
KEEP EXPLORING
You may also need.
REVIEW IT WITH YOUR TEAM
Let’s see how it fits your project.
In a demo, we can review “Flow analytics” and discuss your team’s questions.
Request a demo